In the beginning there is the idea that asbestos may be present in a building material. The only way to be sure is to prove or analyse the presence of asbestos.
The most common and most important method for detecting asbestos is scanning electron microscopy (SEM). It provides two results at once:
- A picture
- The chemical composition
Only in this combination is a statement as to whether it could be asbestos possible. However, the matter is not trivial: it requires extremely clean work and above all a lot of experience, because the danger of confusion is very great.
On this page you will find out why.
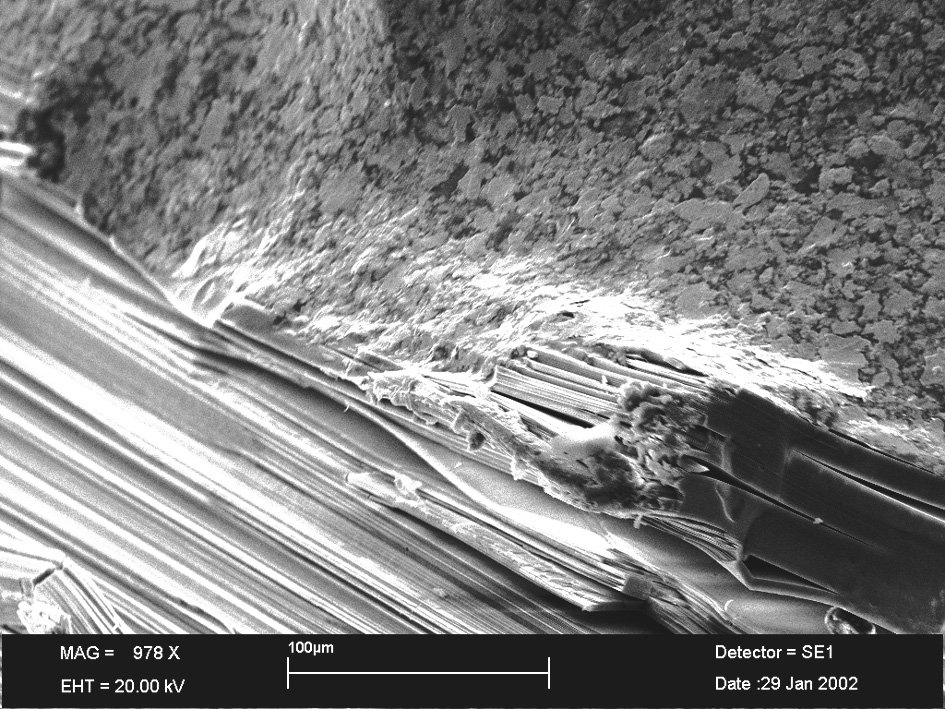
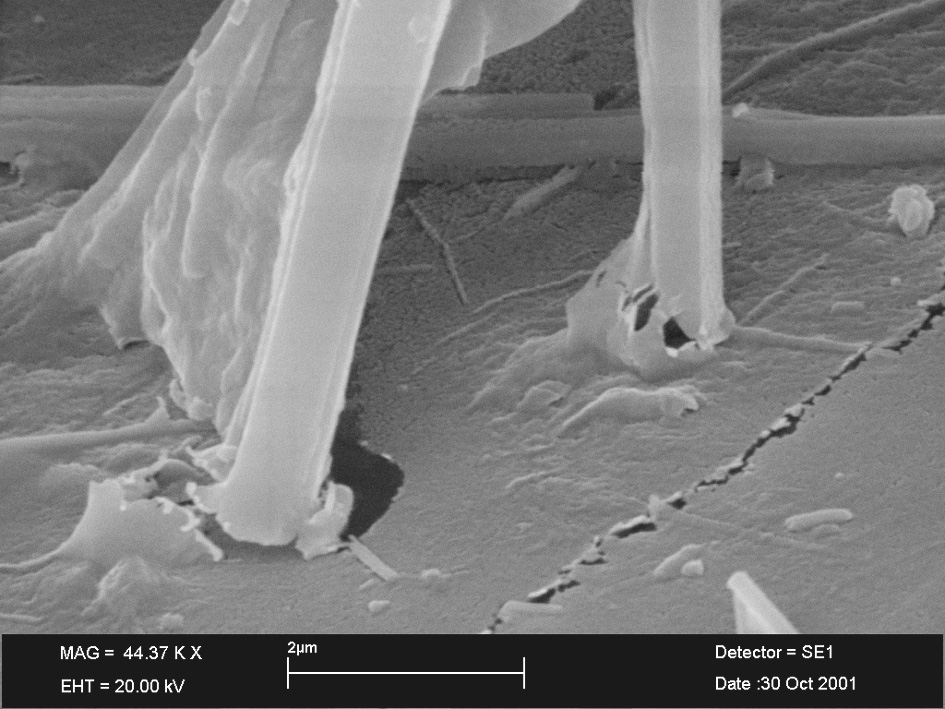
Attention: What you see is not a photo! It is a picture!
We enter a micro-world where you can't do much with a conventional light microscope. What we want to see (or make visible) is simply much too small. A conventional light microscope can magnify about 50 times, a clever SEM up to 300000 times. The image that a SEM produces - or rather: calculates - is not produced by light, but by electrons. In the sample chamber it is pitch dark.
No light is reflected, but electrons and X-rays. Both are captured by detectors. The image is ultimately generated by a computer.
In a vertical tube, an electron beam is shot from a hot cathode under high voltage (approx. 20 kV) at the sample in the sample chamber. The beam is focused and moved with electromagnetic "lenses". It scans the sample line by line like an old tube TV. Hence the scanning electron microscope.
As we know, moving electrons are moving charges - and that is electric current. In order for current to flow, the sample must be conductive. But it is not conductive from the outset. This is why it is vaporized with gold, carbon or even platinum before analysis. Only very thin so that the surface structure remains intact. We don't want gold bars. At least not here.
We bomb the sample with very fast electrons. The choice of words is intentional. As soon as the electrons hit the sample, several things happen there:
The electrons hit other electrons and shoot them out of the atom like billiard balls. These electrons are called secondary electrons. They are collected and analyzed by a special detector called the SE detector (for secondary electrons). On the side facing the detector, more electrons fly towards the detector than on the opposite side. Therefore, the image becomes brighter there (to put it simply - other factors also play a role - as always). This also creates the spatial impression. The SE detector provides the data for the beautiful image.
Some of the electrons are scattered back. These are also captured by a detector. The BSE detector. This has nothing to do with the Kreutzfeld-Jakob disease. It stands for back-scattered electrons. This also produces an image, but not so beautifully three-dimensional, but flat and in light-dark contrasts.
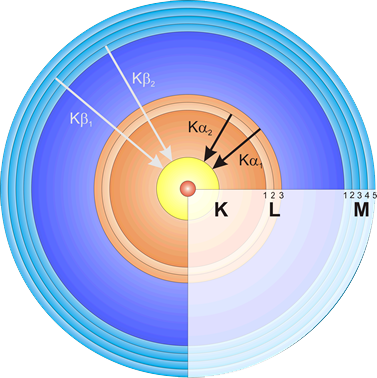
The most important effect: The ejected electrons leave gaps which have to be filled again immediately. Now comes some chemistry: The shell model. From a shell further outside (in this model these are the spherical concentric tracks on which electrons fly around the atomic nucleus), e.g. the L-shell, an electron falls onto the inner K-shell (where the gap was created) and loses energy. The "distance" between the shells corresponds to a certain amount of energy, which is characteristic for each element. A photon, a short X-ray pulse, with exactly this amount of energy is released and measured by the EDX detector. EDX stands for Energy-Dispersive-X-Ray detector.
This effect provides us with the chemical composition of the sample in the form of an EDX spectrum.
So we have a beautiful, impressive picture and an abstract spectrum with a zigzag line.
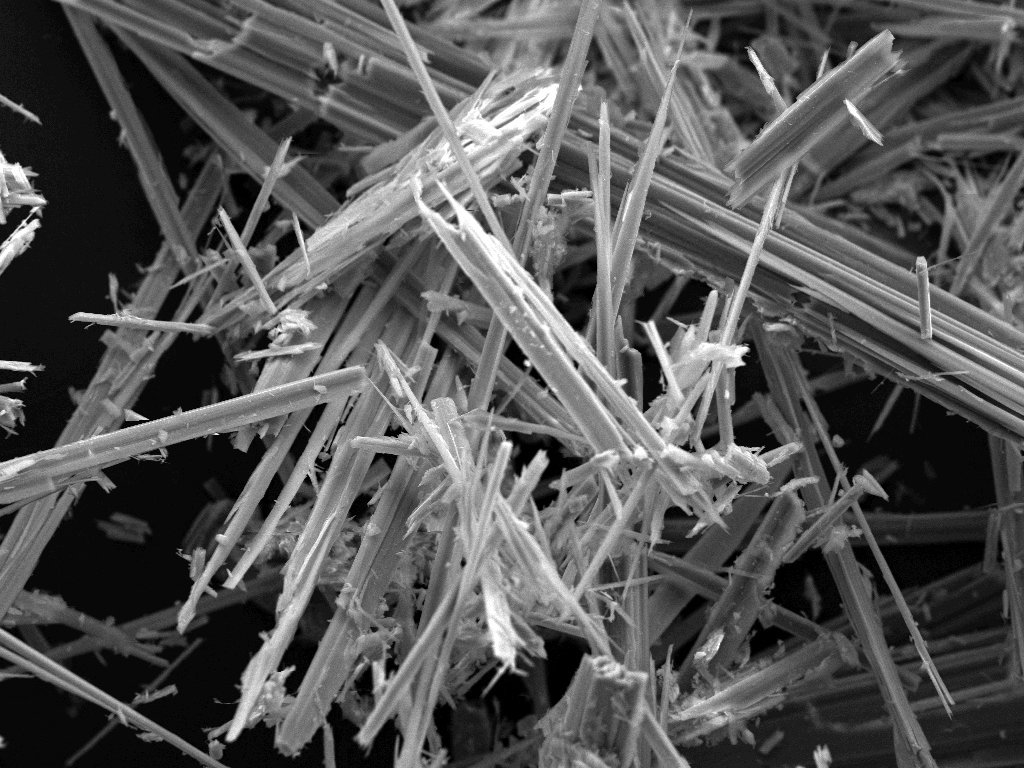
To interpret the picture is rather simple. You can see needle-like or fibrous structures among other things. That could be asbestos, it's fibrous or needle-like.
But this zigzag diagram with the letters... what's that about?
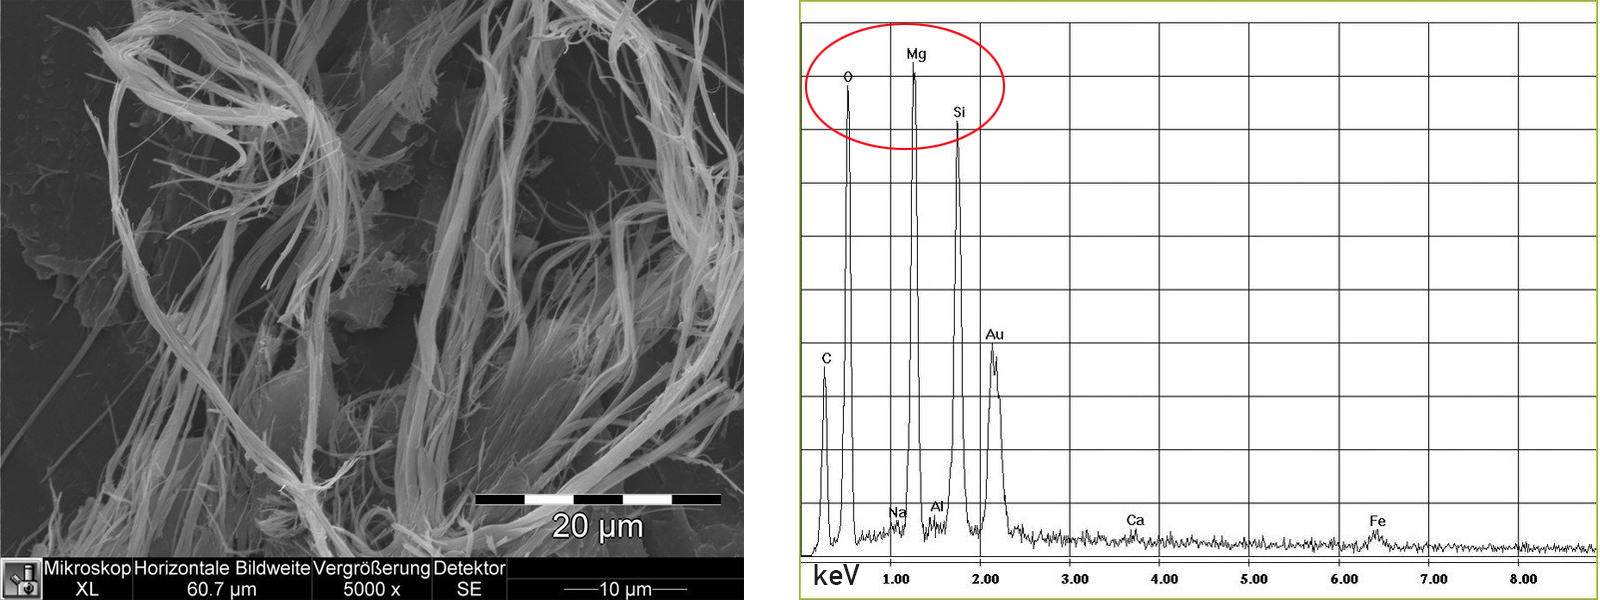
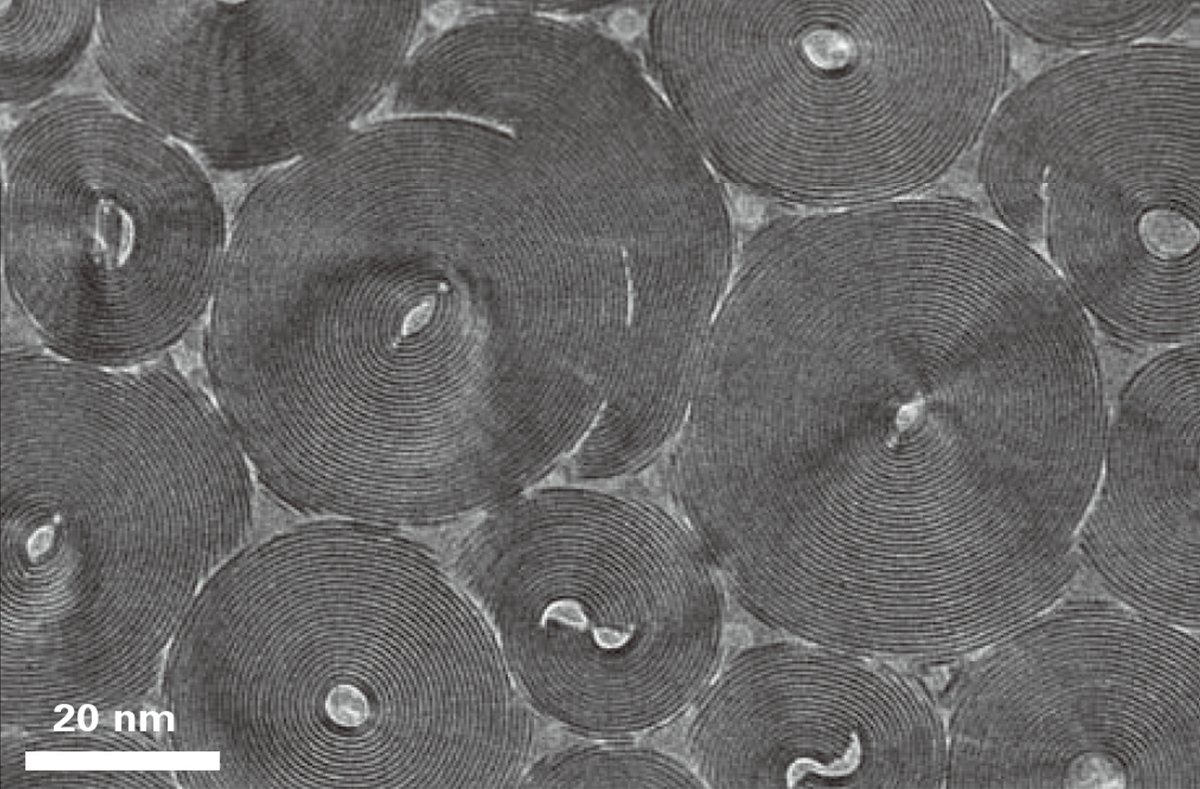
The picture on the left shows the typical curly fibres of chrysotile asbestos with plenty of split ends.
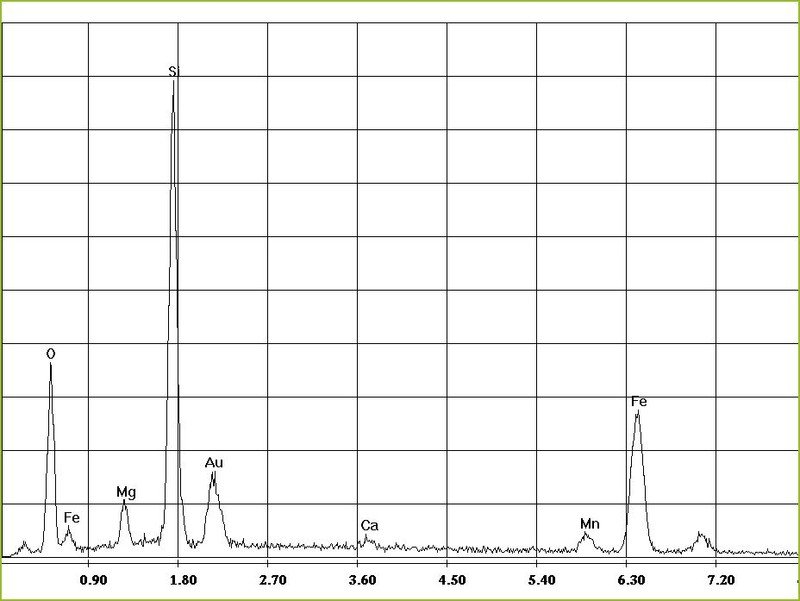
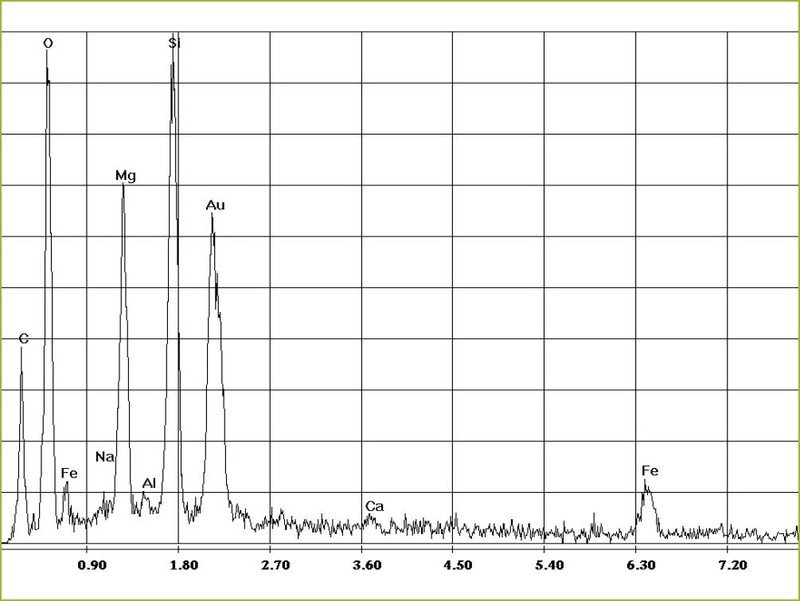
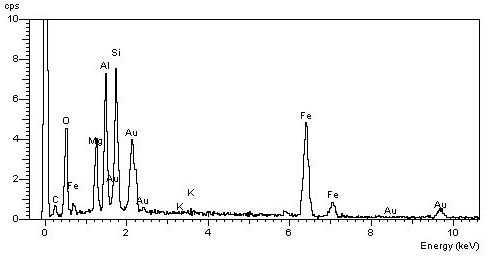
What do we read from the EDX diagram?
The teeth are so-called peaks. Each peak represents a certain element. We had shot an electron out of the K-shell. The gap is filled by an electron that "falls down" from the outer L-shell. This releases energy - in the form of an X-ray quantum or photon. A flash of light that cannot be seen... This amount of energy is the fingerprint of exactly one specific element.
Accordingly, the lower axis stands for the energies - and thus for different elements. The peaks for each element are always at the same place. The height of the peaks is proportional to the frequency of the element. But this is even more complicated. Let's say it almost hits the mark and we get an impression of the quantity, though not an exact number.
The 3 highest peaks are in our case the elements Mg, Si and O. Hooray! Exactly the elements we need for Chrysotil - right?
Gold (Au) is still there, but that's the coating and carbon (C), probably from the adhesive pad on which the sample is glued to the carrier. Very little iron (Fe), not worth mentioning.
We conclude from this: Beautiful curls in the picture and the necessary elements-
That must be chrysotile!
| Mineral | Formula |
|---|---|
| Chrysotile | Mg3 Si2O5 (OH)4 |
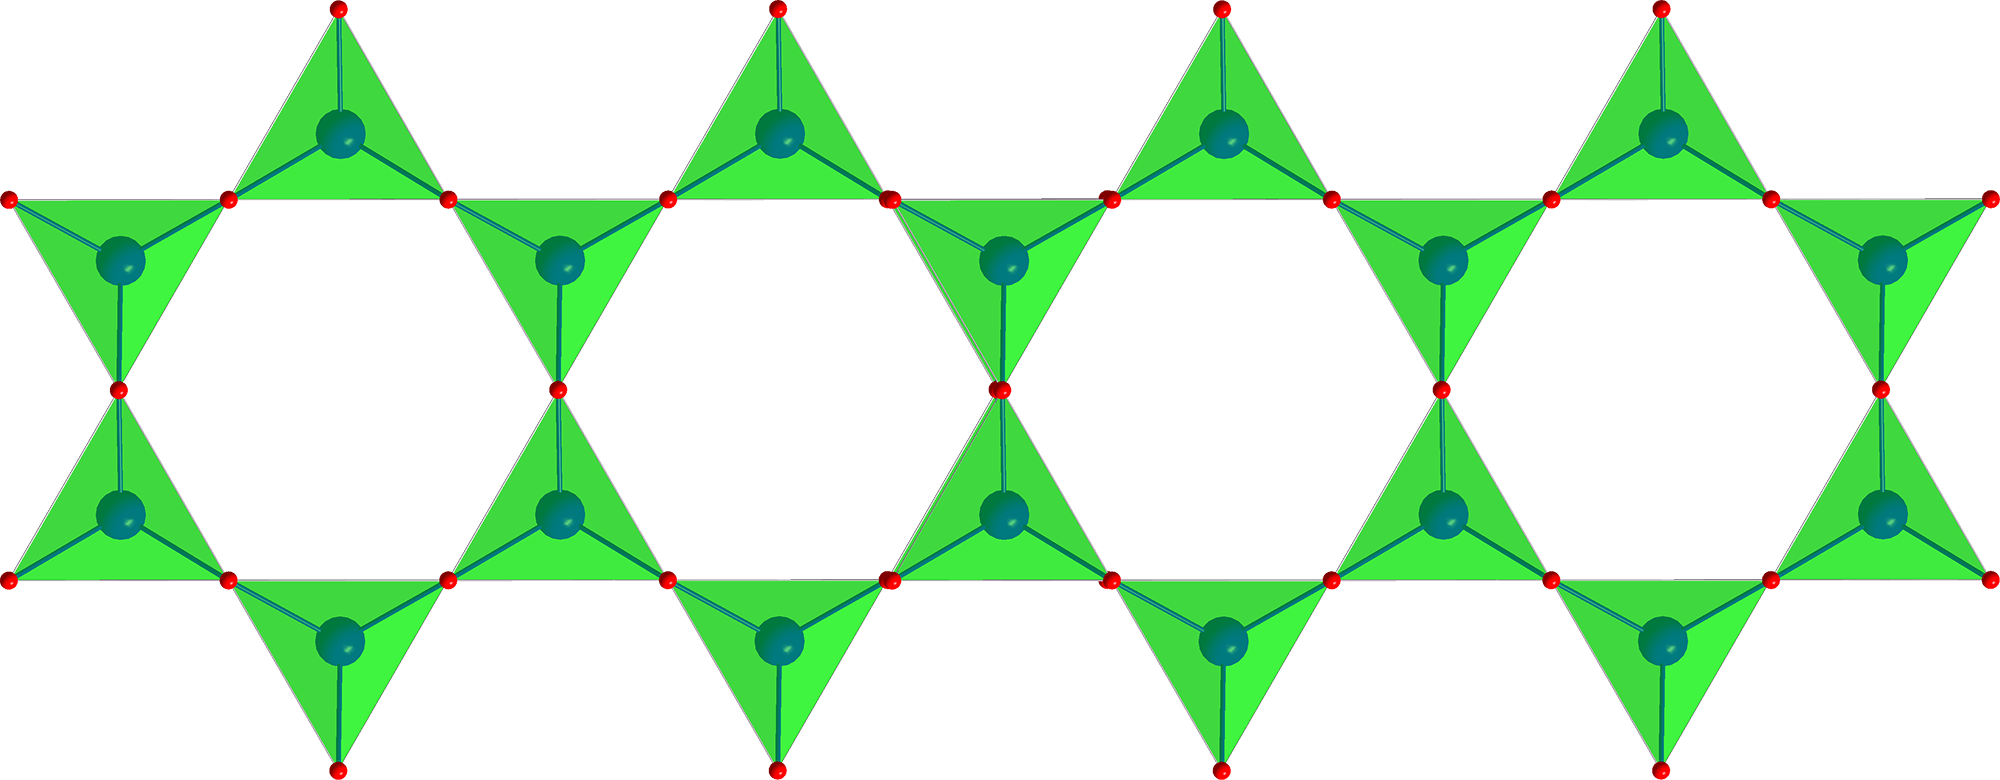
Other important types of asbestos fibres are made from amphiboles. Amphiboles have the typical band structure of SiO4 tetrahedra.
| Mineral | Formula |
|---|---|
| Krokydolith (Riebeckite) | Na2 Fe2+3 Fe3+2[(OH)2 | Si8O22] |
| Tremolite | Ca2 Mg5[(OH,F)2 | Si8O22] |
| Aktinolith | Ca2 (Mg,Fe)5[OH2 | Si8O22] |
| Amosite (Grunerite) | (Fe2+, Mg)7[(OH)2 | Si8O22] |
| Anthophyllite | (Mg, Fe2+)7[(OH)2 | Si8O22] |
Do you see the similarities? Nature takes what it can get and builds something out of it. Only the basic plan is always the same: (metal) 7 [(OH)2 | Si8O22]
Je mehr Elemente in den Asbesten vorkommen, desto schwieriger die Analyse, denn diese Elemente kommen in fast allen anderen (nicht-Asbest) Silikaten auch vor!
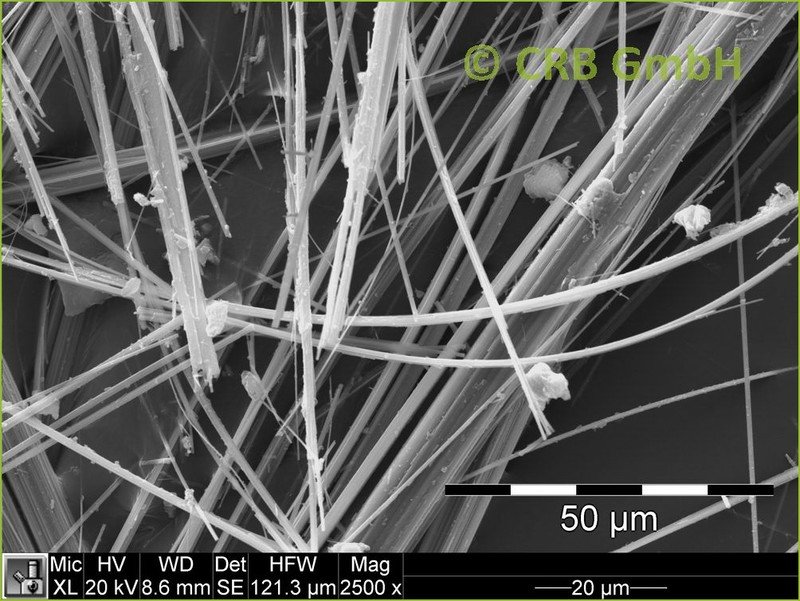
- Bilder 1 und 2
Amosit (ein Amphibol Asbest , auch Grunerit oder "brauner Asbest" genannt.
Chemische Formel (Fe2+, Mg)7 [OH | Si4O11]2 - monoklin.
- Bilder 3 und 4
Anthophyllit, ebenfalls "brauner" Amphibolasbest.
Chemische Formel (Mg,Fe2+)7[OH | Si4O11]2 - orthorhombisch
Der Unterschied zu Grunerit ist einzig die Kristallstruktur. Die Chemie ist exakt gleich. Moment mal, ist sie wirklich exakt gleich?
-
[Translate to Englisch:] Amosit © CRB GmbH -
[Translate to Englisch:] Amosit EDX Spektrum © CRB GmbH -

[Translate to Englisch:] Anthophyllit © USGS Gemeinfrei CC0 -
[Translate to Englisch:] EDX Spektrum von Anthophyllit © CRB GmbH
Have you noticed that the Mg peak is very small in amosite and quite high again in anthophyllite? Both have exactly the same chemical composition! And if both have the same amounts of Fe and Mg, why aren't the peaks the same?
First of all:This is why the interpretation of the results is quite difficult.
- Secondly:
Of course you have to consider the matrix, i.e. the environment. Was only the one mineral measured or the whole sample together with the other stuff that is still lying around?
- Third:
Look at the formulas again: Both Mg and Fe are in brackets, separated by commas. Behind it is 7, so they share 7 places. Who gets how many seats, does not stand there. Only with amosite Fe stands in front and with anthophyllite Mg. That means: With Amosite Fe has a clear advantage and probably got (at least) 4 out of 7 places.
-
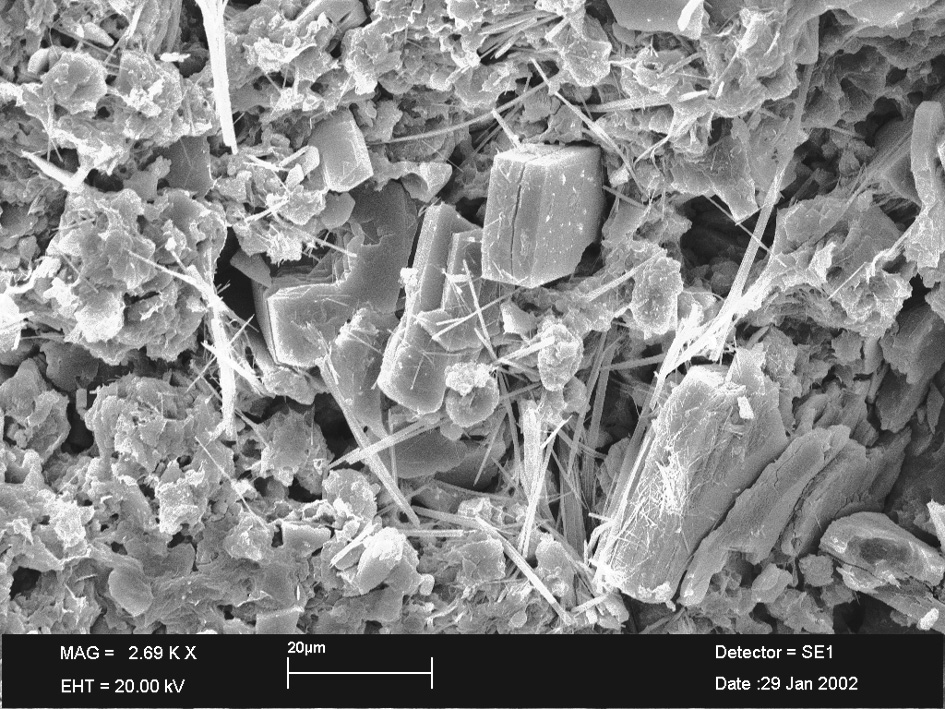
[Translate to Englisch:] REM Aufnahme von porösem verwittertem Vulkangestein mit Feldspat, Montmorillonit und Faserzeolit © Heiko Hofmann -
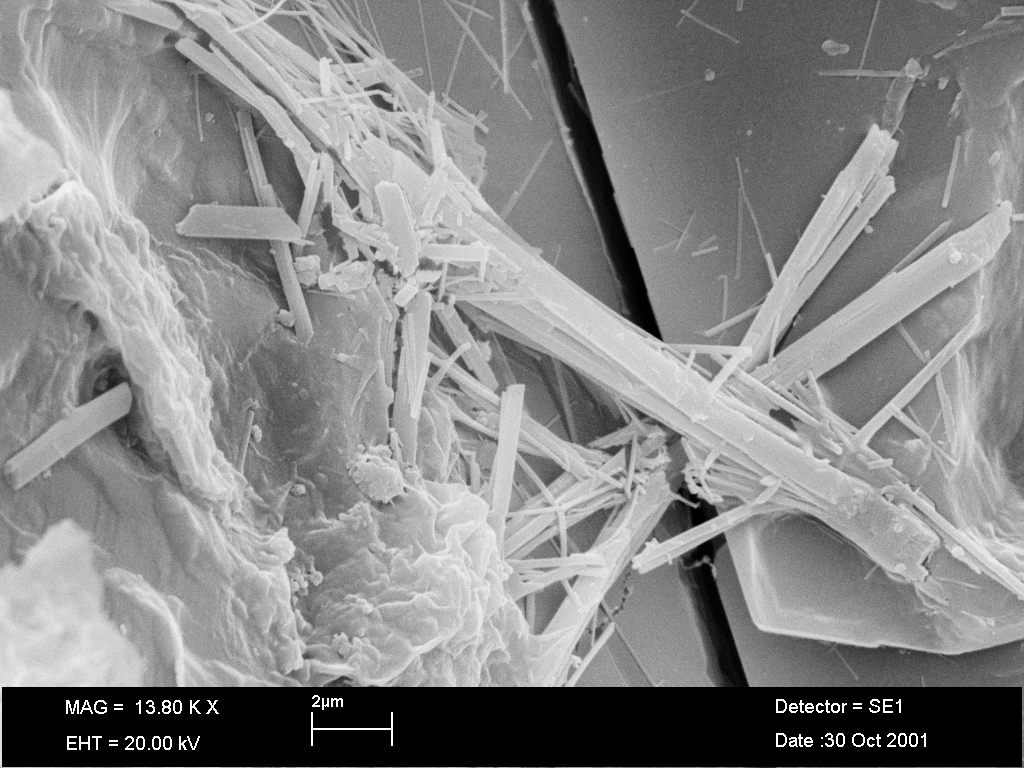
[Translate to Englisch:] Faserzeolit auf Feldspat mit Montmorillonit © Heiko Hofmann -
[Translate to Englisch:] Faserzeolit mit Montmorillonit-Membran auf Feldspat © Heiko Hofmann -
[Translate to Englisch:] EDX Spektrum der Probe © Heiko Hofmann
The photos were taken from a rock sample from Argentina. It is the product of a weathered volcanic ash. During its transformation, the clay mineral montmorillonite, a layered silicate with almost the same chemical composition as chrysotile asbestos, is formed in the sea water.
The fibers are typical zeolite fibers that can develop as a kind of transition stage. These are also silicates, which consist of the same building blocks as asbestos minerals.
In the EDX spectrum one sees beside the usual suspects still aluminium (Al), which feels very well in feldspar, zeolite and montmorillonite. Remember: octahedron with Al in the center?
The elements you see in the EDX spectrum of asbestos can be found in all silicates! And very, very many silicates have at least one modification that grows stalkily or needle-like or fibrous.
So be careful: Just because you see fibers in the SEM and the expected elements appear in the EDX spectrum doesn't mean it's asbestos!
So a lot depends on the analyst's experience in interpreting the results.
Everything that has been told so far only gives us a statement as to whether it is asbestos or not. So it's purely qualitative!
The limit values, however, are about the quantity, the quantity and standardized, i.e. related to a limited volume, namely 1 m3. Only then do we speak of a fibre concentration.
Fibres on a surface
This is only possible via the type of sampling, which, by the way, is also precisely defined. One can take so-called "copy samples" or "contact samples" by simply removing the particles (including dust) adhering to a surface with an adhesive strip. However, this only allows conclusions to be drawn about the number of particles on a surface, but not about the volume. This type of sampling is useful to find out how far asbestos fibres may have spread from a source and sedimented there.
Fibres in ambient air
The decisive factor, however, is the room air we inhale and the number of fibres it contains. No adhesive tape is enough. For this purpose, a certain amount of air must be "inhaled" through a so-called "sampler" and at the same time the particles must be sedimented on a sample carrier, which is later to be placed in the SEM. This is somewhat more complex, but feasible. In the end, this applies to both samples: Count!
This is now fully automatic, but the software must of course be able to distinguish asbestos fibres from other stuff. And the software is only as clever as the programmer. Which brings us back to the analyst's experience.